Wireshark
Wireshark is probably the most well-known and used protocol analyzer in information technology today. It’s available (most days… except for today for some reason) at https://www.wireshark.org. Linux, Windows, Mac, whatever. It runs fine. It’s also pretty easy to use. It has a Graphical User Interface (GUI – pronounced gooey) or a window for easier usage than say tcpdump. It can sniff traffic using various wired and wireless interfaces. It can even be extended or customized.
In this blog, I was going to cover some introductory things I have learned using Wireshark and, at the end, mention Brad Duncan’s filters that I have recently become acquainted with (Thanks @executemalware).
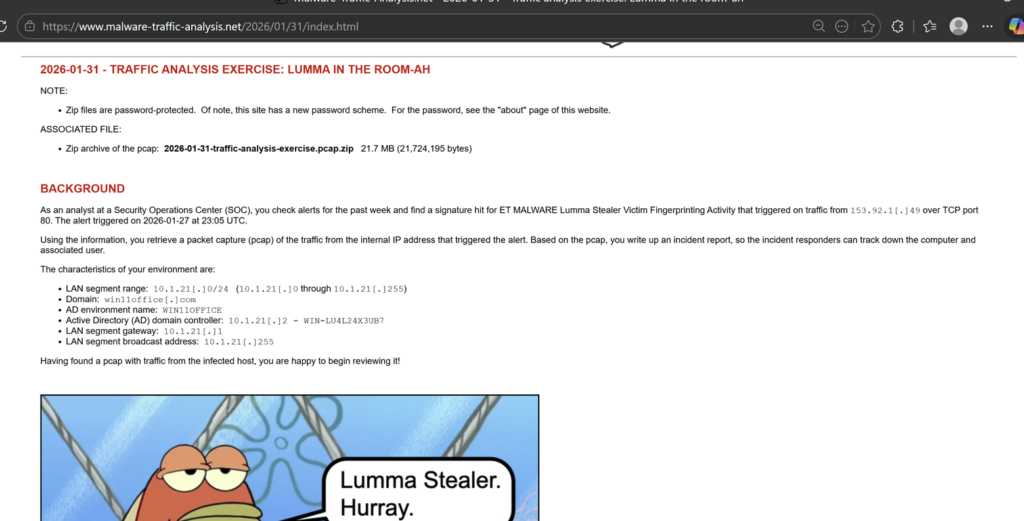
For this example, I used a sample I downloaded from https://www.malware-traffic-analysis.net. So, I should again mention Brad Duncan, who is kind enough to host the site and provide some good, relevant training sets/quizzes to learn from. For those new to the site, be sure to check the about page for the password details.
So, let’s open Wireshark (assuming you have downloaded it), then click File -> Open and select the .pcap file we downloaded and unzipped. Looking at the Open PCAP in Wireshark, I see the packet list pane, details pane, and bytes pane.
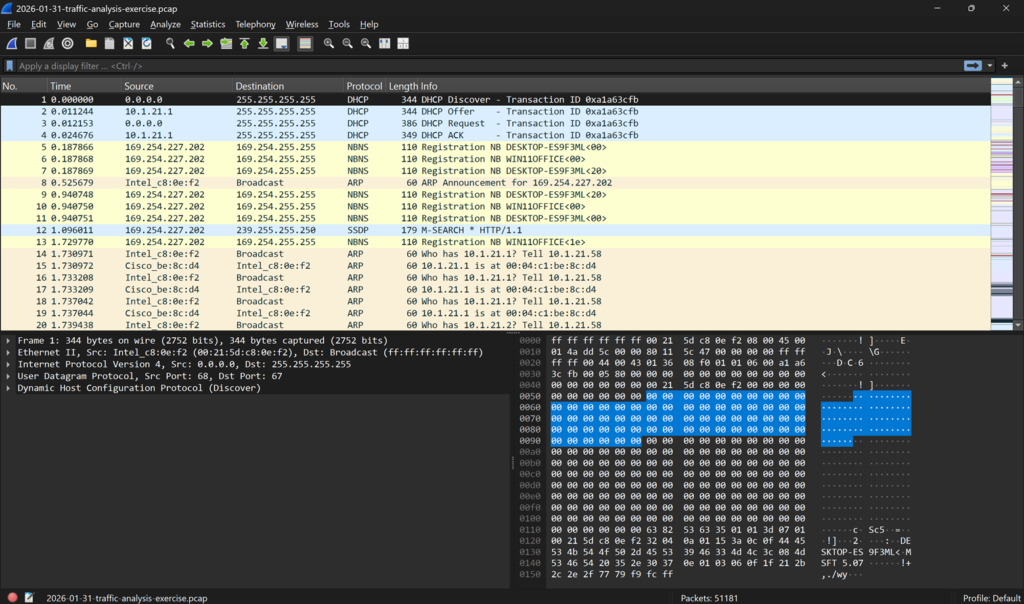
At the bottom of the screen, I see the total number of packets (51,181) Looking at the top horizontal toolbar, I can see the statistics tab. Let’s look at that, too, and see some options Wireshark offers us.
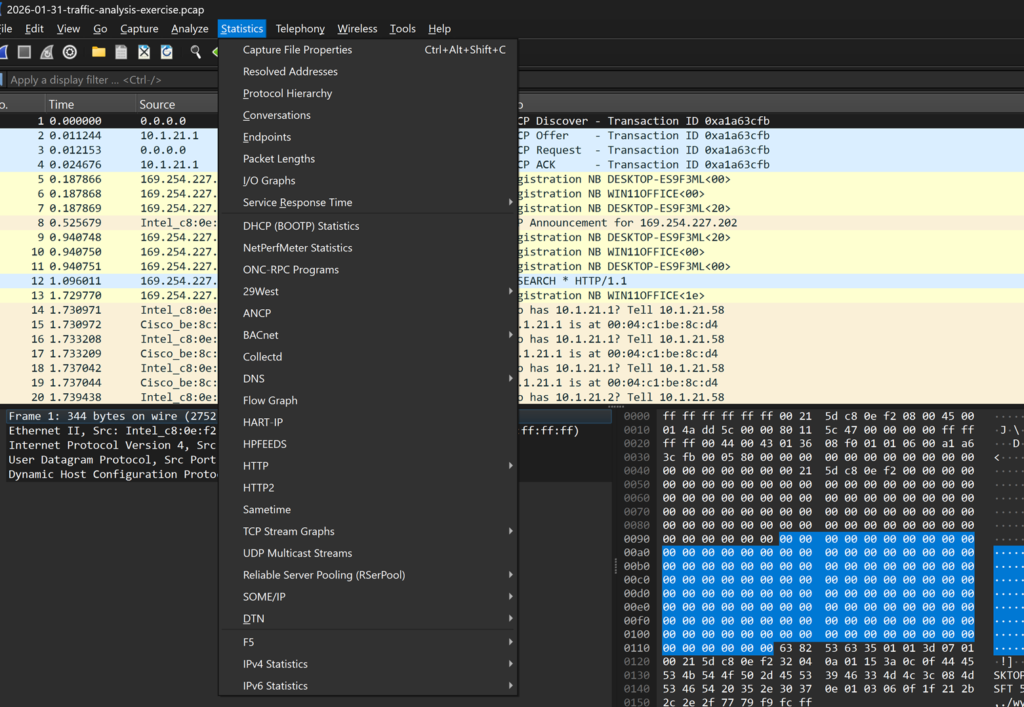
One thing I have learned from SANS courses when reviewing packet captures is to use the Protocol Hierarchy option to get a lay of the land. A high-level view, if you will (lol). After that, I generally go to conversations and then check TCP and IPv4, and then filter for bytes to still get a high-level but closer look at what I am seeing here.
In our sample here, we have done that, and this is what we see: our dominant addresses in the conversation:
Now it’s time to actually get some work done and see what’s going on here. We have some IP addresses and byte counts, which can be useful to know or assess for different reasons, like suspected data exfiltration, but we don’t know what has happened.
Looking back at the packet list pane, it is a big, jumbled mess and can be really straining to view, so maybe we can try to apply some filters. Fortunately, the same guy who provided this sample has given us some filters to apply (via an additional blog series I will link here), but we need to know how to do it first.
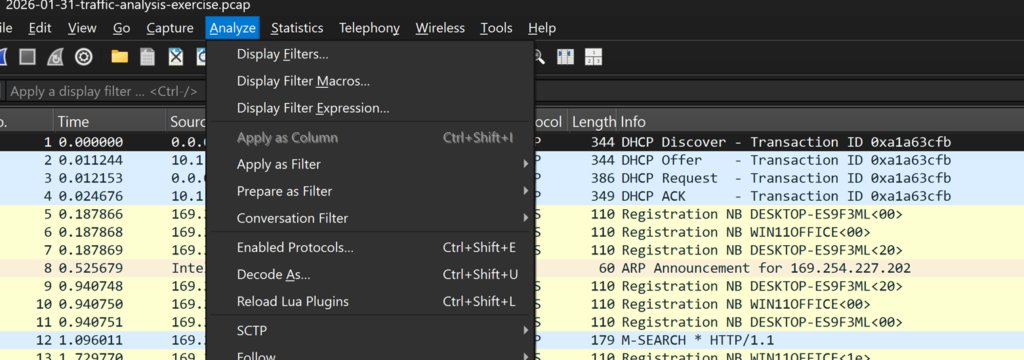
Click analyze and then display filters, filter macros, apply as filters, or follow.
We can go to Display Filter expressions and then filter for one of our dominant IP addresses.
It should look something like this when filtering for our dominant talker:
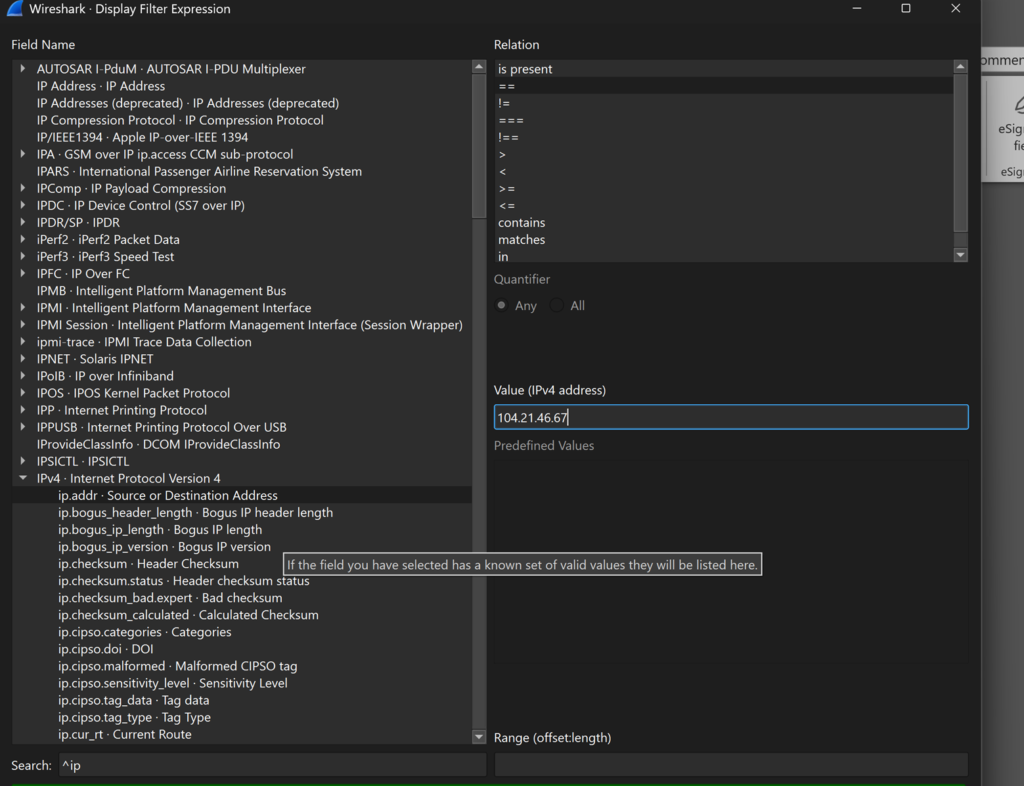
Then click okay and press the arrow in the packet list pane to apply your filter.
Looking at the results, we are kind of stuck…. It’s all encrypted and indecipherable. We have a couple of server name identifiers, but maybe we can look into something else.
So in the filter bar, I just type http and then click the arrow again. I see more activity that is a little clearer to review
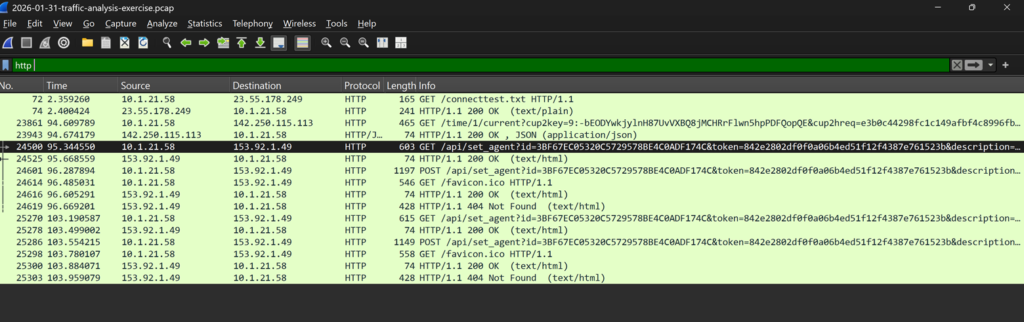
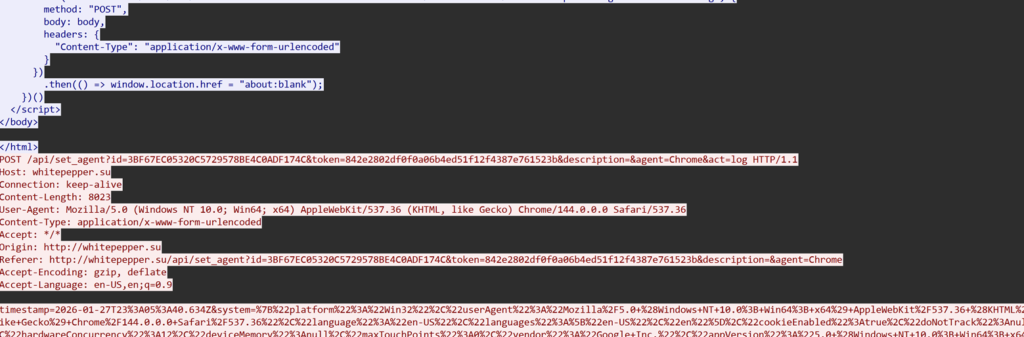
Following the http, we see a domain with a Soviet Union TLD (.su). It is white pepper [.]su, and you can see some of the http below
Well, let’s apply one of Mr. Duncan’s filters, and see what happens next (http.request or tls.handshake.type eq 1) and !(ssdp):
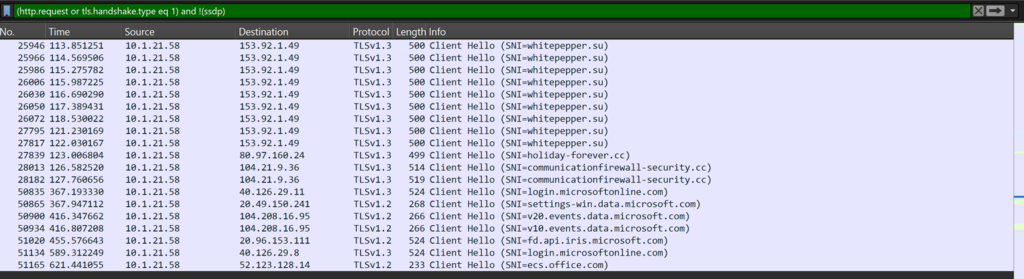
Scrolling a little bit, we see a couple more SNIs. holiday-forever[.]cc and communicationfirewall-security[.]cc.
Now, we don’t exactly know what this means, but according to the lab, we are responding to an alert for Lumma stealer. Assuming this traffic was successful, in addition to being suspicious and having sufficient traffic to indicate a potential compromise, we need to identify our device and user and perform remediation actions. But how do we do that from a pcap?
Well, we searched our HTTP packet forms and searched through available data and found nothing. Unless we can review different protocols or have other tools to help us figure this out, we are screwed. Fortunately, we do have different protocols to look through.
We know the internal IP that was talking to the suspicious domains, so let’s start there.
Searching the net bios name service, we gain some more insight.
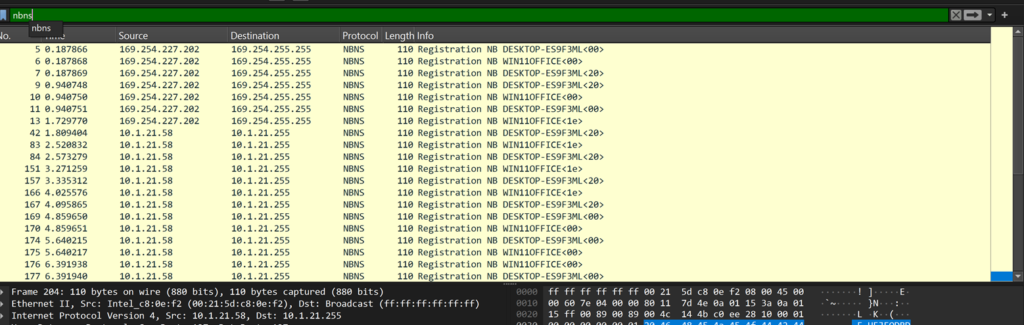
We now have a MAC address, a desktop name, and an internal DHCP-assigned address, but no user. Let’s pivot.
Searching Kerberos and our IP, we see a few different things:
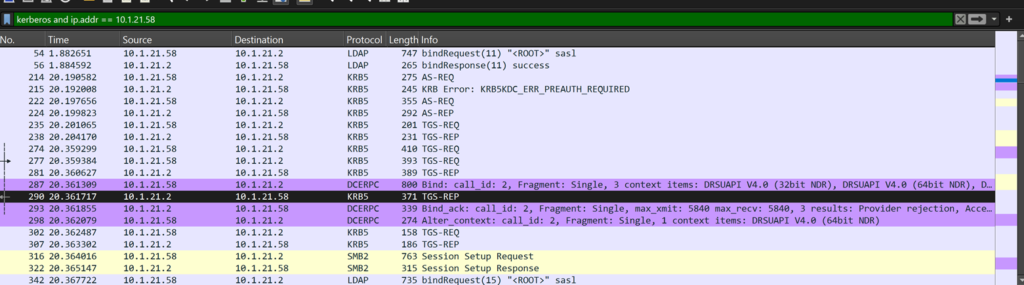
One of these values is the ticket authentication service request (AS-REQ), so let’s look there.
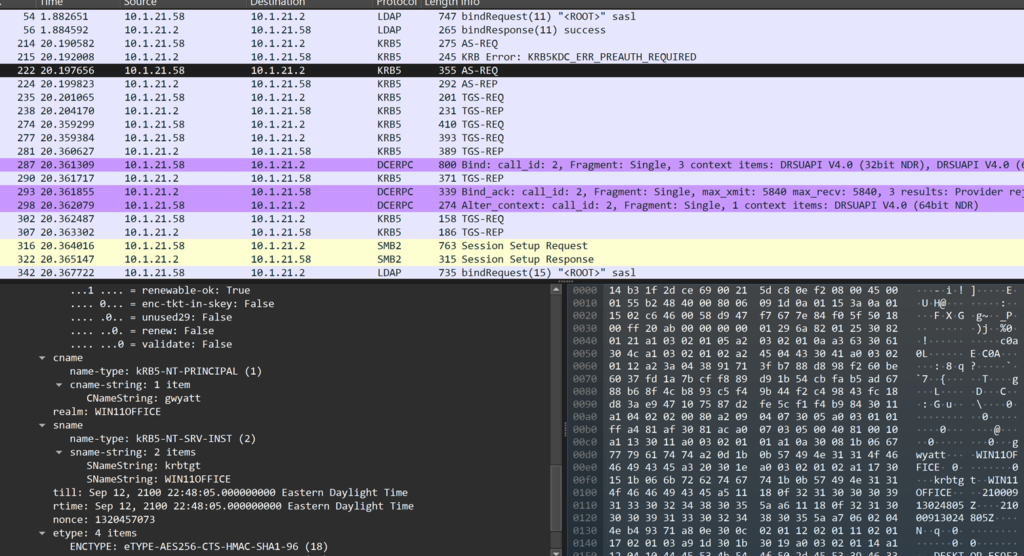
Looking under the Kerberos field, we see the Cnamestring, gwyatt. It looks like a first initial and last name. Let’s look for the string “Wyatt” in a packet to see if we can find the user’s first name.
We go to edit, find the packet, and then filter for Wyatt (be sure not to have a space at the end) and see the following:
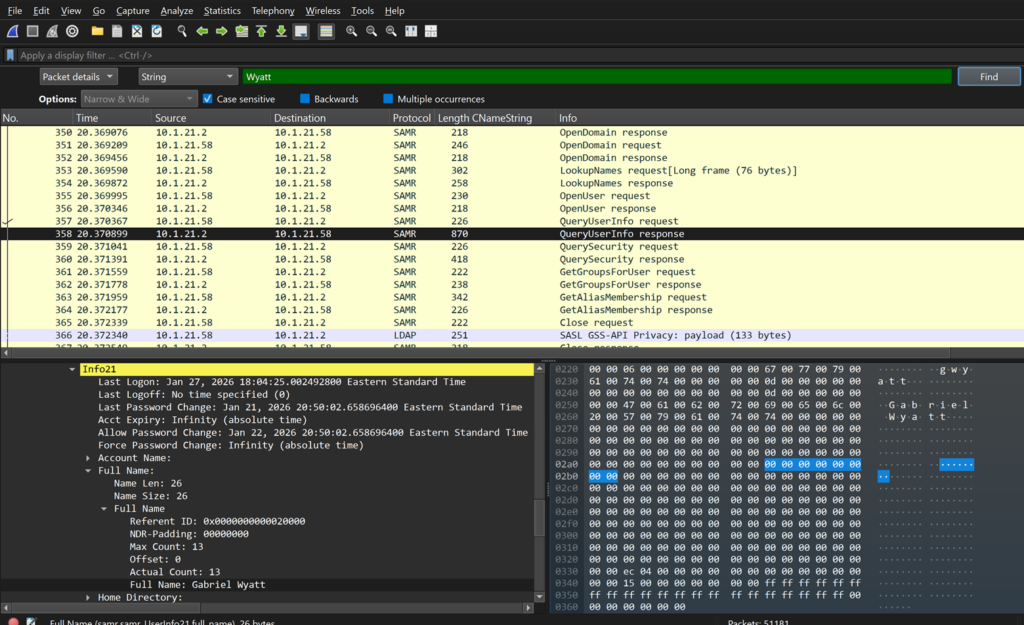
We have our user!
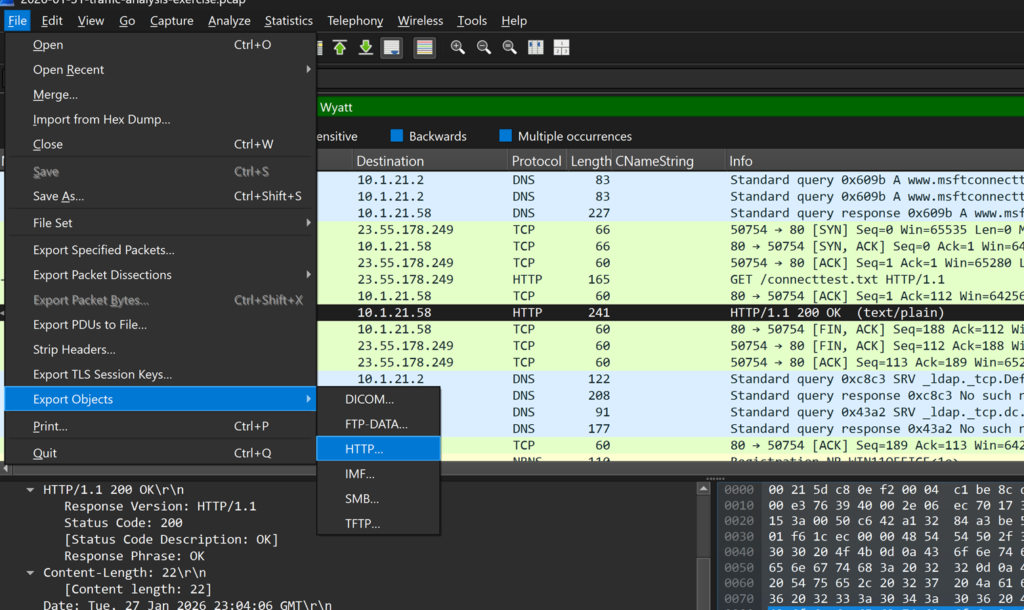
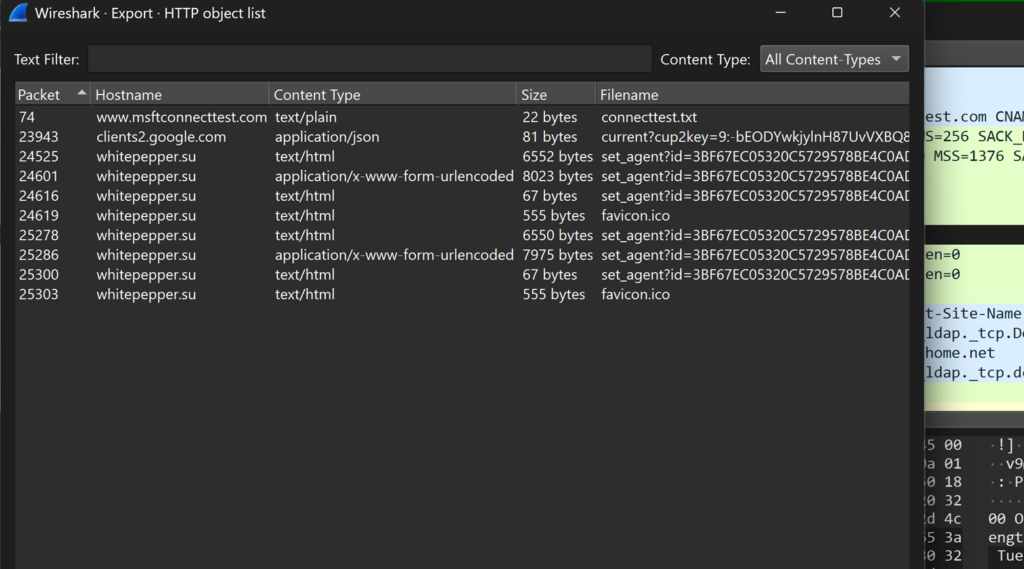
Lastly, we check to see if there are any objects (files) left behind and go to File, export-objects, and search through our suspicious HTTP, and unfortunately, there is nothing like an executable.
While this is a sloppy write-up, I hope it’s beneficial to someone and gives some value. I won’t spend the extra hour tidying this that I probably should, but I hope it is still good for someone to learn to use some new filters and Wireshark features. Oh yeah, and for BETTER reporting on Wireshark, check out the following: Wireshark Tutorial: Display Filter Expressions